(What is this? Check the lab notebook's table of contents)
Started 2024-03-01
Published 2024-03-03
My least favorite part of Entry 005 was positioning all the nodes and charts. My second least favorite part was how long that feature took to design and write about.
So this time, my goal is to add enough pointer input to drag nodes and charts around, and my hope is that I can finish it relatively quickly.
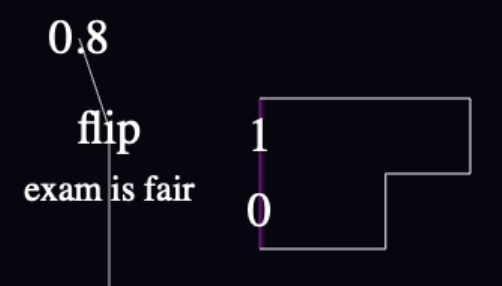
For anyone just tuning in, this image shows what nodes, wires, and charts look like:
The "0.8" and "flip" are nodes. "exam is fair" is a label on the "flip" node. The "0" and "1" are labels on a bar chart on the right.
My goal is to be able to click/tap and drag the nodes and charts around, and for the wires to stay connected.
Implement drag and drop for nodes and charts.
I can't save/load models yet, and I don't intend to change that today, so I will print coordinates before and after every drag so that I can manually copy good values back into the source code.
I'll need two pointer-handling strategies:
I render nodes with CSS2DRenderer using CSS2DObjects that contain HTMLDivElements, so I'll probably need to use browser pointer events. I'm no expert on this, but Red Blob Games's page on HTML draggable object looks comprehensive and I trust them.
Charts are pure Three.js entities and DragControls appears to be the idiomatic way to drag them around simply.
I decided to try having a single code path by using DragControls for everything. The only hitch was that CSS2DRenderer's DOM was on top of WebGLRenderer's DOM (the canvas), so when I attached the DragControls to the canvas, it looked like it wasn't working at all. When I asked DragControls to listen for events on document.body instead (which I figured would work since the canvas is set up to take up every pixel of the display), it worked:
In the future, I'm sure that I'll want pointer events to go to the objects in the CSS renderer or the canvas, so that you can select HTML text without dragging objects that happen to be underneath, for example. But I think I'll be able to do that by putting the event handler on the CSS renderer's DOM, and calling canvas.dispatchEvent in the case where the event isn't going to any particular object (event.target === event.currentTarget).
The red box in the screen recording above is some 3-D rectangle geometry that I added to be the drag region for the chart. But I discovered that DragControls doesn't provide you events with which to update your scene in response to drag events—it just reaches in and moves your objects around. So if I wanted the rest of the chart to move with it, I had two options:
I took the first option since, as I reflected in Entry 002, I've been assuming for a while that I'd need more hierarchy in my graph eventually, and making the drag region the root doesn't seem like it should cause problems down the road.
Anyway, it works!
However, it doesn't solve all my problems:
I didn't anticipate all this. I have scope creep on my hands. 🤦🏽♂ Here's where I landed:
And… done!
This is how it looks with all the drag regions visible:
I don't consider this a public change. I will consider this PPL information software, for which "interactivity is the last resort," until I'm convinced that it's interpretable enough that other people might actually be interested in creating new models. I think we should be able to learn a lot from a model without a single click.
I just added this bit of interactivity for my personal use, and a change of pace.
As far as implementation goes, although this change forced me to to finally add some hierarchy to my scene graph, I didn't fully commit. Every scene graph node's translation is still (0, 0, 0) except when modified by DragControls. I suspect that I'll still need to address this one day—but today was not that day.
This was a lovely diversion. I look forward to creating moderately more attractive models as I test new language features.