(What is this? Check the lab notebook's table of contents)
Created 2024-02-09
Published 2024-02-13
I decided in Entry 001 to start implementing the visual language I've been imagining. The notes are primarily in my paper notebook. I have so many questions, most of which are about these three areas:
I think I can muddle my way through the first and third bullets (representation and execution semantics) if I work backwards from the way that the code is displayed. I know that they're not required, anyway: in today's version, for example, I show WebPPL code on the screen, but what's actually executing is a TypeScript function that I manually wrote to have the same behavior:

During development, I often made changes to one and not the other out of expedience, just to test something out and causing them to go out of sync in the process. But it's useful for making my intention clear when sharing the work and when feeling it out for myself.
So the purpose of this first experiment is to take a baby step toward the visualization I've had in my head for this modeling language.
I'll start with a small WebPPL program:
Infer(function() {
  flip(0.5) + flip(0.95) + flip(0.25)
})
I'll write a TypeScript version for evaluation, which will be straightforward. I'll return every intermediate value so that they can all be tallied and visualized separately.
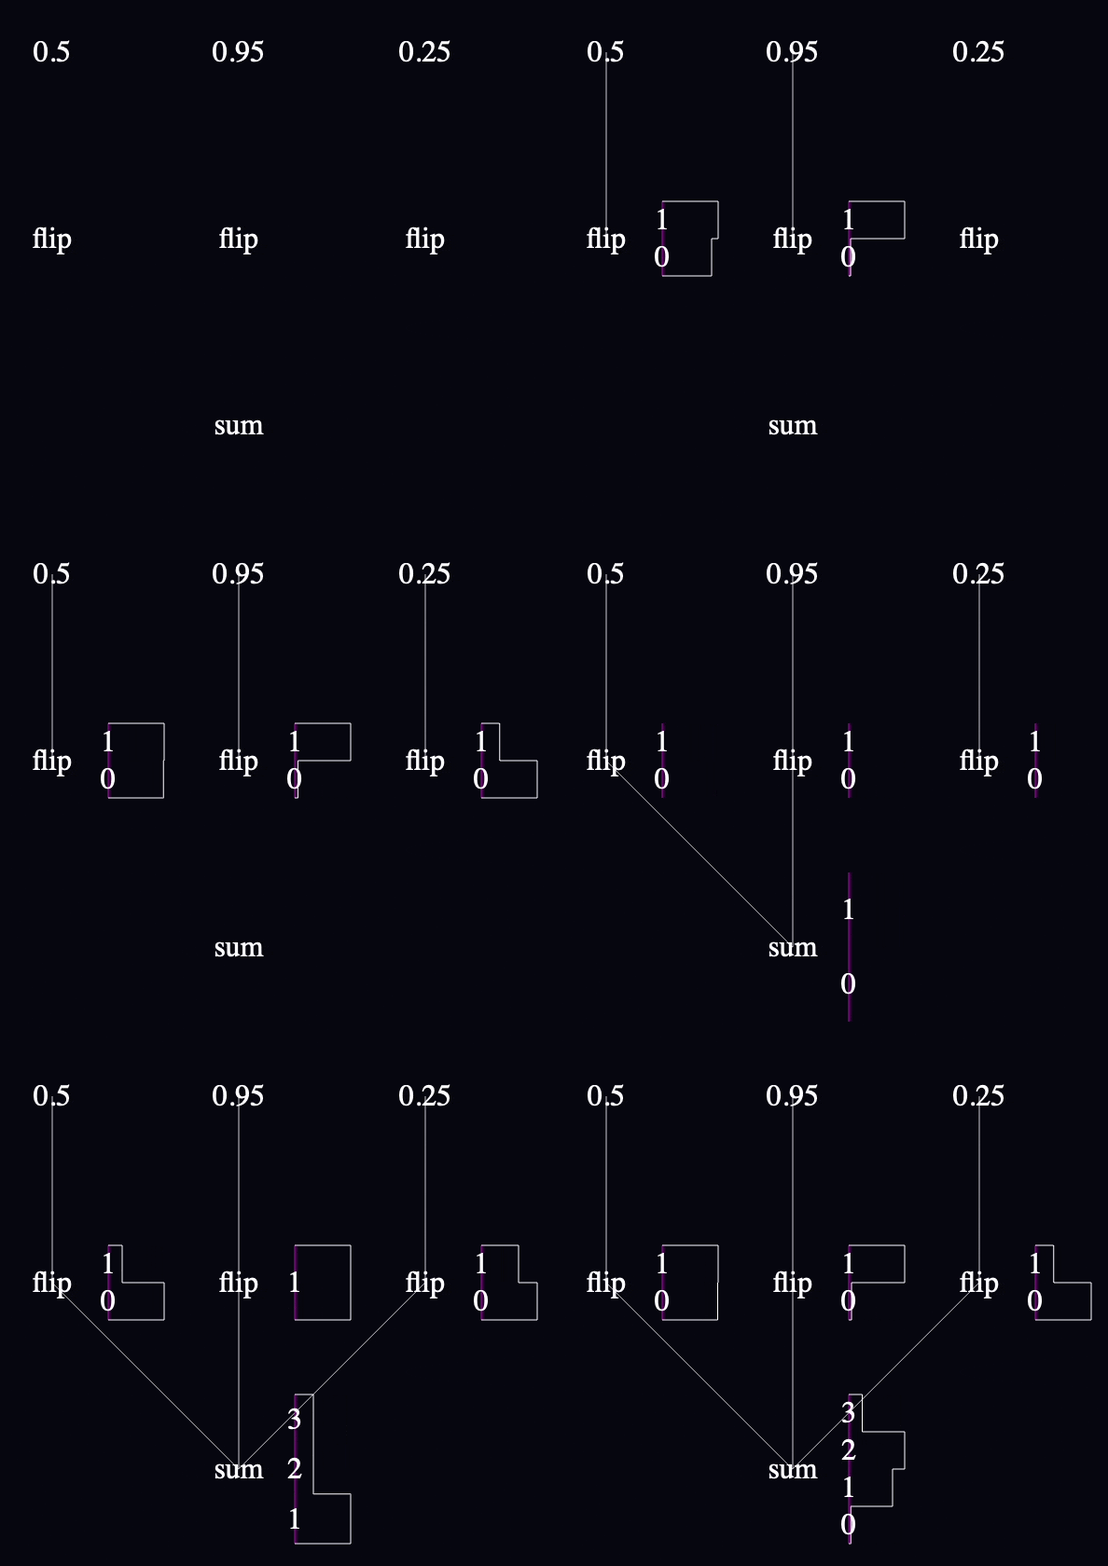
Visually, I think I'll want nodes for each of the numbers, nodes for each call to "flip", one "+" node, wires connecting all of them, and charts next to each node.
This example is simple enough that the call graph will correspond 1:1 with the code on the screen. That's easy mode for a visual language, but for now, I just want to get something on the screen. Later I can think about factor(), inline anonymous function definitions, named & reused function definitions, repeated invocations, etc.

Easy peasy.
I created a bar chart class for rendering discrete PDFs, and Node and Wire classes to manage the rendering of nodes and wires.
In order to make the graph appear incrementally, I created an animation where each keyframe contains the list of Nodes and Wires that should appear, and which Sampler to use. Most of the frames use Samplers with the same model code, since most edges don't create interactions between the distributions at each node. However, there are separate programs for when there are only 1 or 2 wires connected to the "sum" node, since those wires change sum's distribution.
Since each frame has a different Sampler, all the distributions reset at every frame. In a real system, I want the distributions to persist and just morph to the new distributions, rather than start from scratch after every change—I think the most recent sample would make a fine initial location for a restarted MCMC, for example—but this will do for now.
I'd say that the yak I shaved most was the bar chart rendering. I started by rendering each bar as an actual rectangle consisting of two triangles facing the camera, but it had too much visual weight, so I deleted it and drew the silhouette of the bars using one, unbroken, single-pixel white line instead. This rhymed with the first chart type I made (drawing a continuous PDF as a curve) and just looked better.
I took care with the internals of the bar chart renderer as well. I allocate a buffer large enough to hold all the vertices that I should ever need for each chart, write active vertices to the front of the buffer, use setDrawRange to tag the active part of the buffer, and trigger uploads by setting needsUpdate. I wasn't sure if I should specify each bar as a separate scene object or as one object like this. The Three.js authors publish a GPT-based mentor that keeps telling me to use separate objects because Three.js can translate and scale them more efficiently, but I imagine it can't be more efficient than just updating the 6 floats per bar that I'm using to specify point locations if all those locations are changing anyway?
The reason I focused on trying to use GL efficiently is that I had a bad time optimizing the number of draw calls in Infinite Sketchpad, and the main thing that made it painful was that I started with a model where each object (line) drew itself, and the migration to a coordinated rendering scheme was gnarly. I do not want to repeat that process. I eventually rendered the entire sketch with a single draw call, and the process gave me an appreciation for the way modern GL wants you to use buffers. I expect that Three.js does a great job minimizing draw calls, but I don't want to thwart it by using the API in a way that I can guess is inefficient.
One thing about the way I render that I anticipate needing to fix at some point is that every coordinate everywhere is in the world coordinate system, the one whose coordinates correspond to pixel coordinates on the screen in the underlying canvas. In other words, every node in my scene graph is attached to the root node, with no scales or rotations anywhere. I will eventually want to scale and rotate things relative to points other than the origin, and at that time I will want more shape to the scene graph, but I expect that I'll be able to introduce nodes to handle that then, piecemeal, so I don't feel as if I'm adding too much tech debt by eschewing it for now.
After I was done, I examined Chrome's performance tab, fixed the window resize code that was accidentally trying to scale the canvas on every frame, and grabbed a few random frames' timings to get an idea of where I stand:
I am generally happy with the bar charts. Thoughts:
I am very unhappy with the wires. Thoughts:
I changed the background to an off-black, but I want more. I don't know what.
Anyway, I can imagine working with these primitives. I want to drag the numbers closer to the flips. I can easily imagine drawing the wires by hand. Not much more to say about such simple pieces.
So far, so good. Let's add more to the language.